How The Space Coast Wire's Weather Station Network Sees This Storm
Our model, built from a Space Coast Wire weather station, a GOES-19 dish and official forecasts, points to 5 to 7 inches of rain for most of Brevard through Friday, with higher totals possible near the coast.
Written with AI assistance, with sources linked below.
Local Weather
Measured on Brevard's beachside by our own weather station
- Wind
- 10 mph SW, gusts 19 mph
- Rain today
- 3.98 in
- Humidity
- 96%
- Pressure
- 30.14 inHg → steady
Updated 8:04 PM ET
Our station's outlook (based on local readings, not an official forecast)
Flood Warning in effect: rain and storms on radar near Brevard now. NWS Melbourne, until Thu 11:00 AM ET.
Based on readings to 8:04 PM ET. Rules: 3- and 12-hour pressure change, wind shift and humidity/dew point trend. For official forecasts and warnings see the National Weather Service in Melbourne.
Sun
Sunrise 6:47 AM · Sunset 5:29 PM
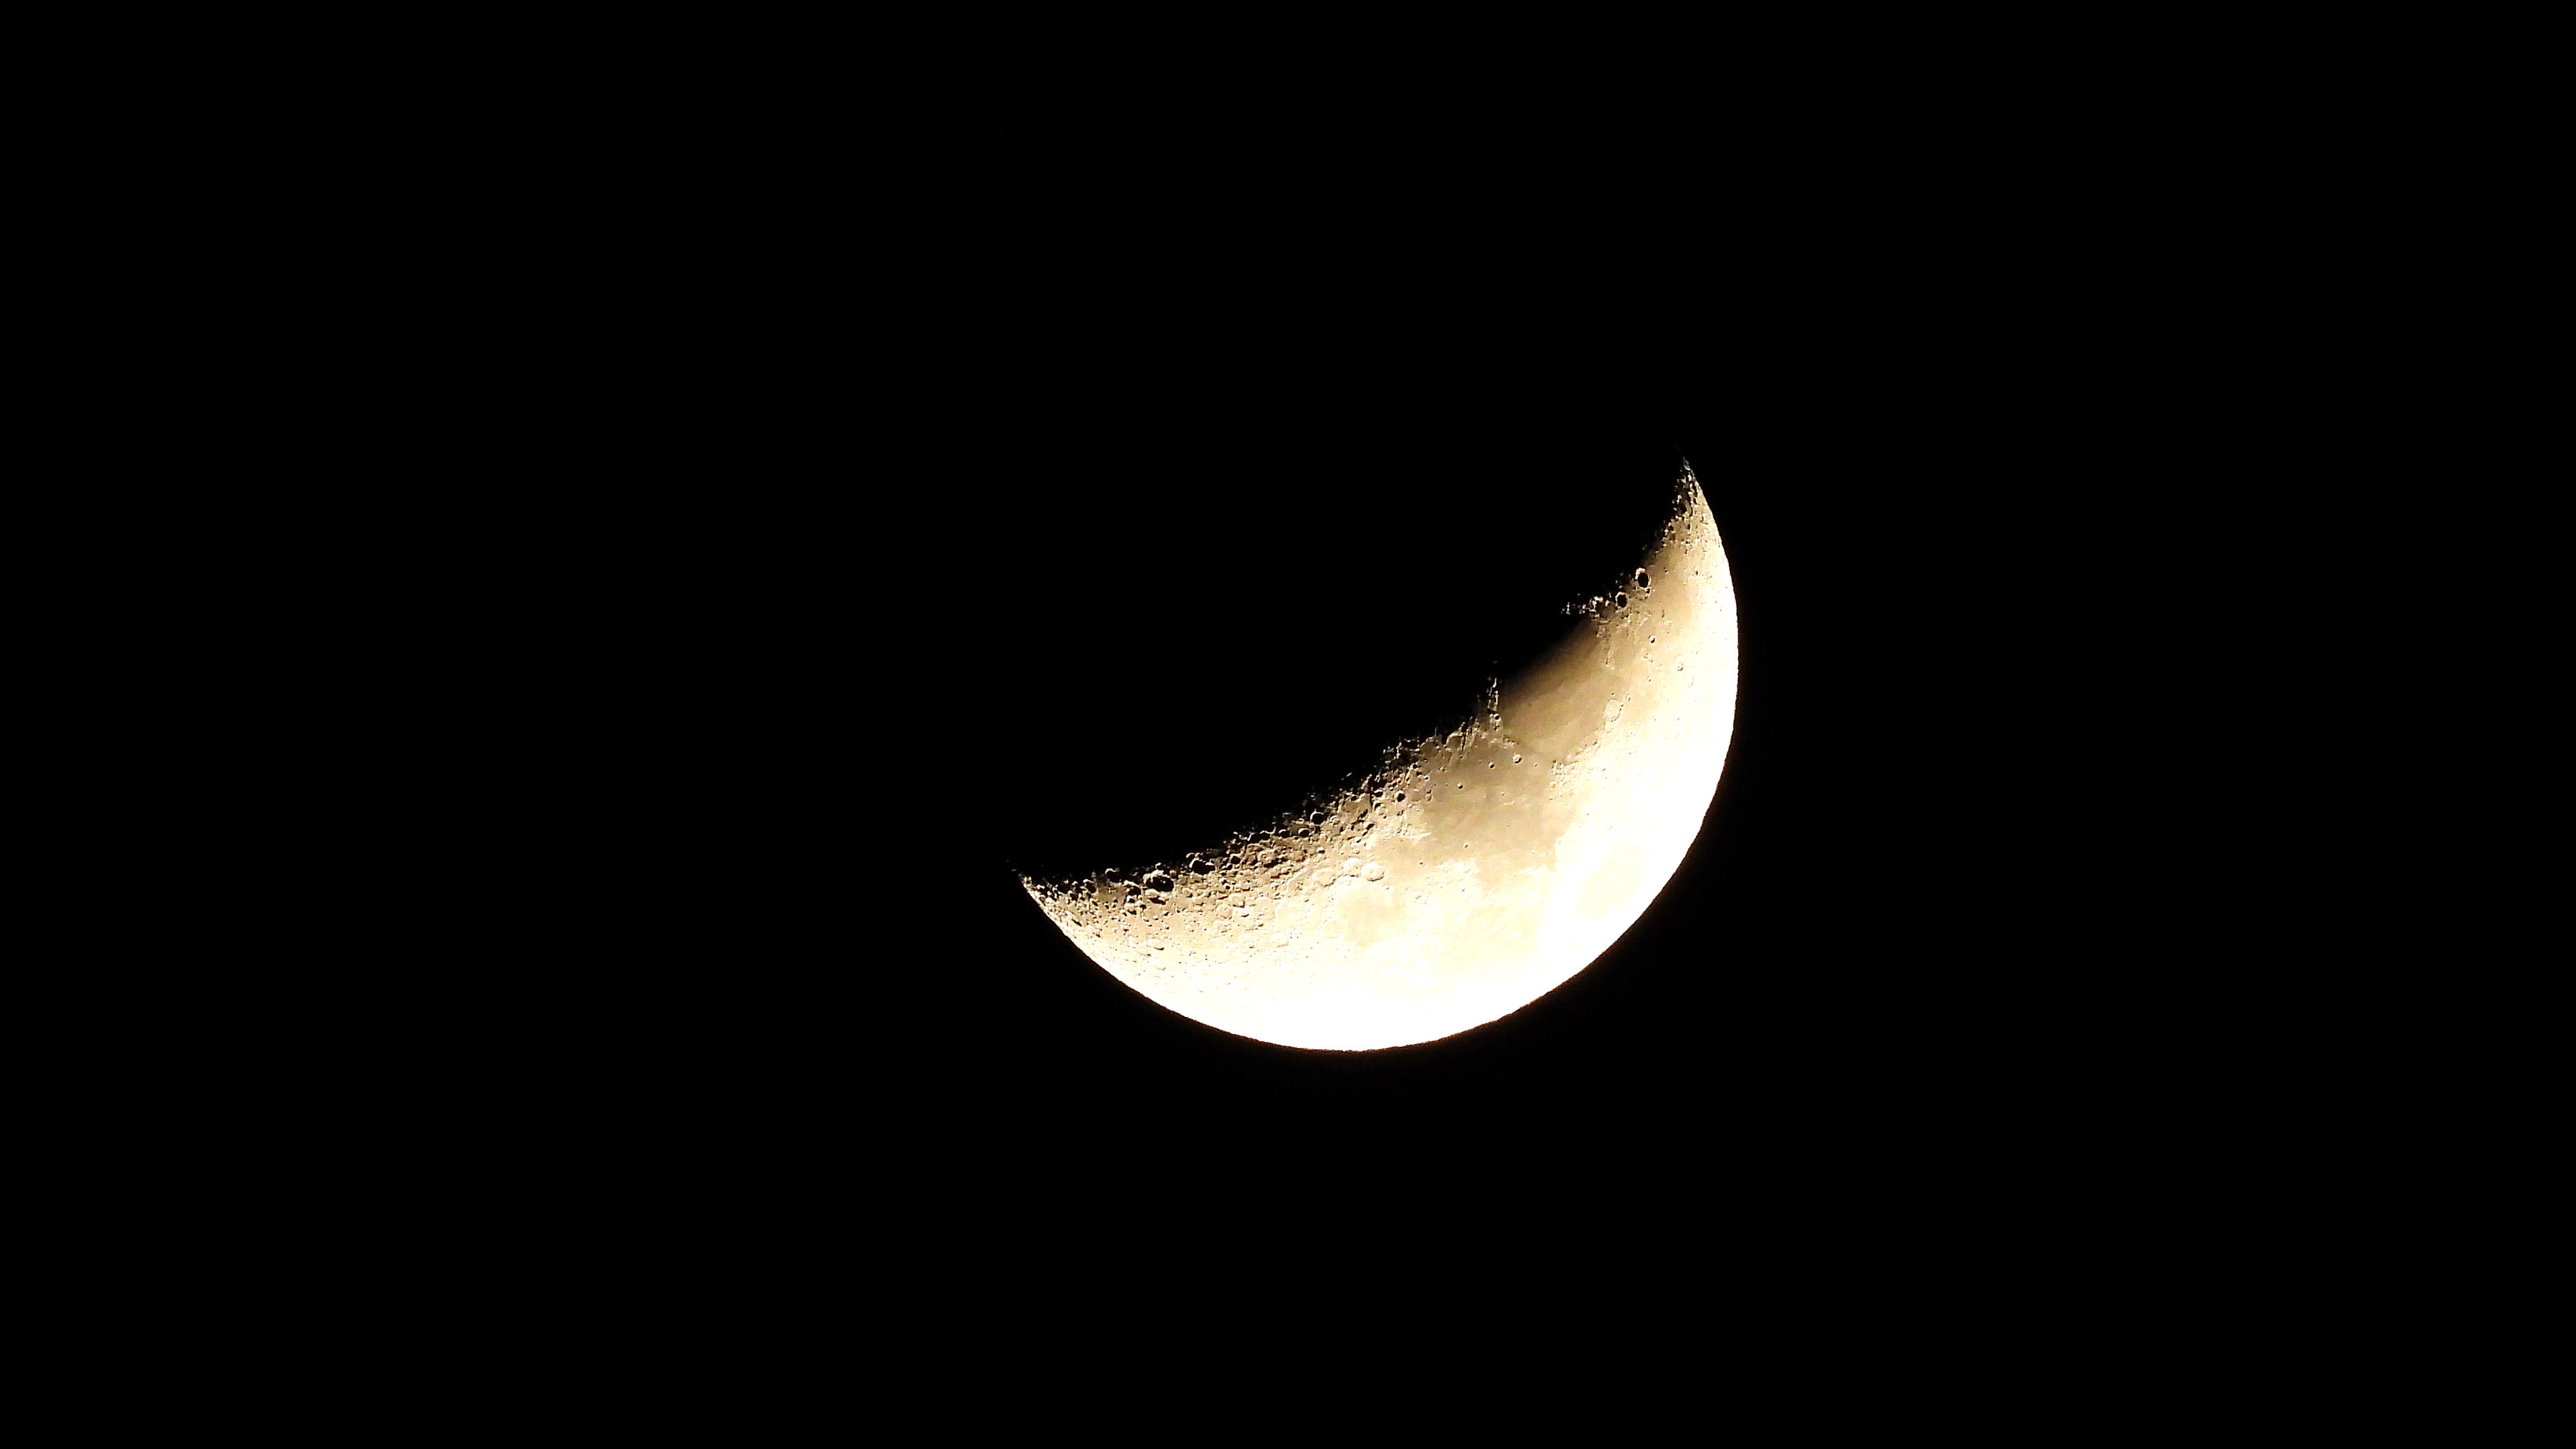
Moon
First Quarter, 66% lit
Sun and moon times are calculated on our server for Brevard's beachside. Daily weather log, records and forecast →
Confirmed by: NWS Melbourne Area Forecast Discussion, issued 6:48 p.m. EST Tuesday, Nov. 17, 2026, NWS Melbourne Flood Watch (FLZ747 / FLC009), Active NWS alerts for FLZ747 (Flood Watch, High Surf Advisory, Rip Current Statement), NOAA NDBC station 41009 observations
A little more than two weeks after a storm dumped more than 12 inches of rain on parts of south Brevard, another long soaking is setting up. The National Weather Service in Melbourne has a Flood Watch in effect through 7 p.m. Friday for Brevard and most of east central Florida.
Official forecasts do not agree on how much will fall. So we put our own equipment to work next to the public data, and built a Space Coast Wire forecast for 10 places around the county. Here is what we see, what is ours, what is official, and where the limits are.
The forecast: 5 to 7 inches most likely, more near the coast
Our "most likely" totals from 7 p.m. Tuesday to 7 p.m. Friday, with a likely range:
- Titusville: 7.3 in (likely range 1.7 to 10 in)
- Cocoa Beach: 7.1 in (1.9 to 10 in)
- Melbourne: 6.7 in (1.5 to 10 in)
- Merritt Island: 6.5 in (1.9 to 7 in)
- Rockledge/Cocoa: 6.5 in (1.9 to 7 in)
- Indian Harbour Beach: 6.1 in (1.7 to 10 in)
- Sebastian Inlet/Micco: 6.0 in (1.5 to 10 in)
- Viera: 5.9 in (1.6 to 7 in)
- Malabar: 5.6 in (1.5 to 7 in)
- Palm Bay: 5.1 in (1.5 to 7 in)
The pattern: wetter along the coast and in north Brevard, a bit less inland in the south. The riskiest stretch for most of the county is 1 a.m. to 7 a.m. Thursday, when our model has 1 to 1.6 inches falling in six hours on the coast and the high end tops 3 inches. Palm Bay and the Sebastian Inlet area peak a little later, Thursday morning.
Charts of these totals, of rain by six-hour block, and of how our forecast compares with official sources and the model pack, are in the photo gallery at the bottom of this page.
What the official sources say. The Flood Watch calls for 3 to 6 inches with localized 8 to 12 inches, with the higher amounts most likely in the coastal counties. In its Tuesday discussion, issued at 3 p.m. and sent again at 6:48 p.m., NWS Melbourne forecast widespread amounts of 4 to 6 inches, with locally 8 to 12 inches closer to the coast, and said a small chance of 12 inches or more exists over parts of Volusia and Brevard. The NWS Weather Prediction Center (WPC) is wetter: in its 5:18 p.m. Tuesday three-day QPF, Titusville, the beaches, Melbourne and the Sebastian area are in a 7 to 10 inch band, and the rest of the county is in a 5 to 7 inch band. At Indian Harbour Beach and Malabar, WPC's excessive rainfall outlook is Moderate (level 3 of 4) for Wednesday into early Thursday and Slight after that. NWS Melbourne, after collaborating with WPC, describes a Moderate risk along portions of the northeast and east-central Florida Atlantic coast for Wednesday through Friday.
What the computer models say. We pulled 212 runs from six global forecast systems for every location. The middle of that pack is only 3 to 4 inches, while the Canadian model shows 8 to 11 inches. That spread is the main reason forecasts look so different depending on where you check.
The comparison chart in the gallery shows, for each place, our most likely total and likely range next to the NWS forecast, the Weather Prediction Center's three-day band, the middle of the model pack, and the Canadian model.
From the field: SCW Affiliate Jean, weather correspondent "This is Jean, reporting for The Space Coast Wire. Today brought on and off rain across the area, light precipitation moving in and out through the day, with winds picking up into the evening. A cold front may be sliding in; temperatures have taken a noticeable dip. We measured roughly an inch of rainfall from this event alone, and folks are right to wonder what's still coming. With homes being sandbagged, we do encourage residents to take that step. Safety is the priority: the ground is likely still saturated from recent downpours, so avoid driving through standing water. On a brighter note, drainage improvements have been underway, and crews say the drains are handling runoff much better. This is Jean. Stay safe out there."
How our model works
We checked which models did best one day ahead against what our own weather station in the Melbourne area actually measured, during the Nov. 1 to 2 storm and the showers of Nov. 16 and 17. Every model badly underestimated Nov. 2: the best guessed less than half the real total, one day out. The American short range model and the NWS blend did best, so they get more weight. Our model then blends those weighted models with the NWS forecast, WPC and the model median, nudges totals up modestly because models ran low on both events, and nudges the first day down because the air is still drier than before Nov. 2.
Be clear about the limits: two events is a very small sample. This is version 0.1, and we will score it against what actually falls.
What our equipment shows
Weather station (ours). It logged 1.32 inches on Nov. 1 and 12.33 inches on Nov. 2, then 0.12 inch on Nov. 3, nothing from Nov. 4 to 15, then 0.50 inch Monday and 0.52 inch Tuesday. Air pressure is running about a tenth of an inch higher than before the last storm.
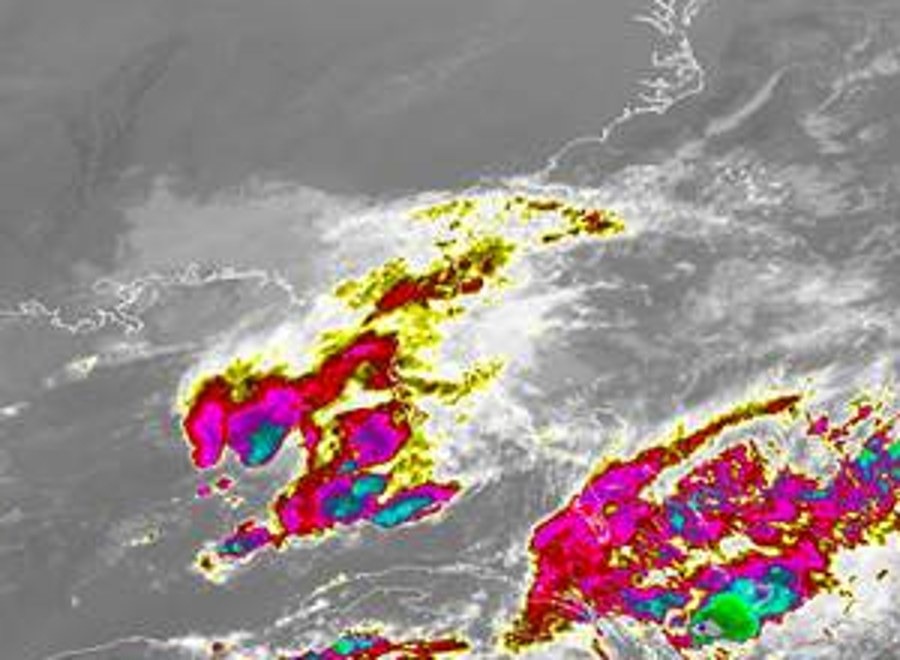
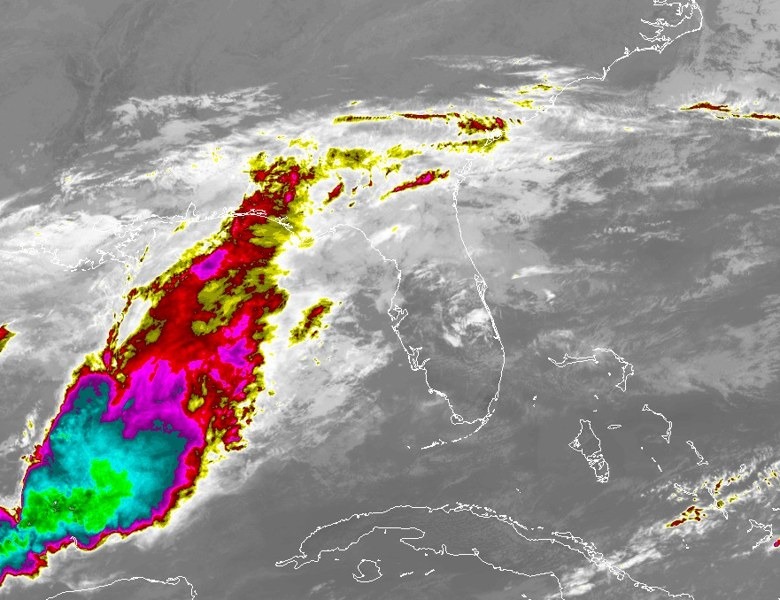
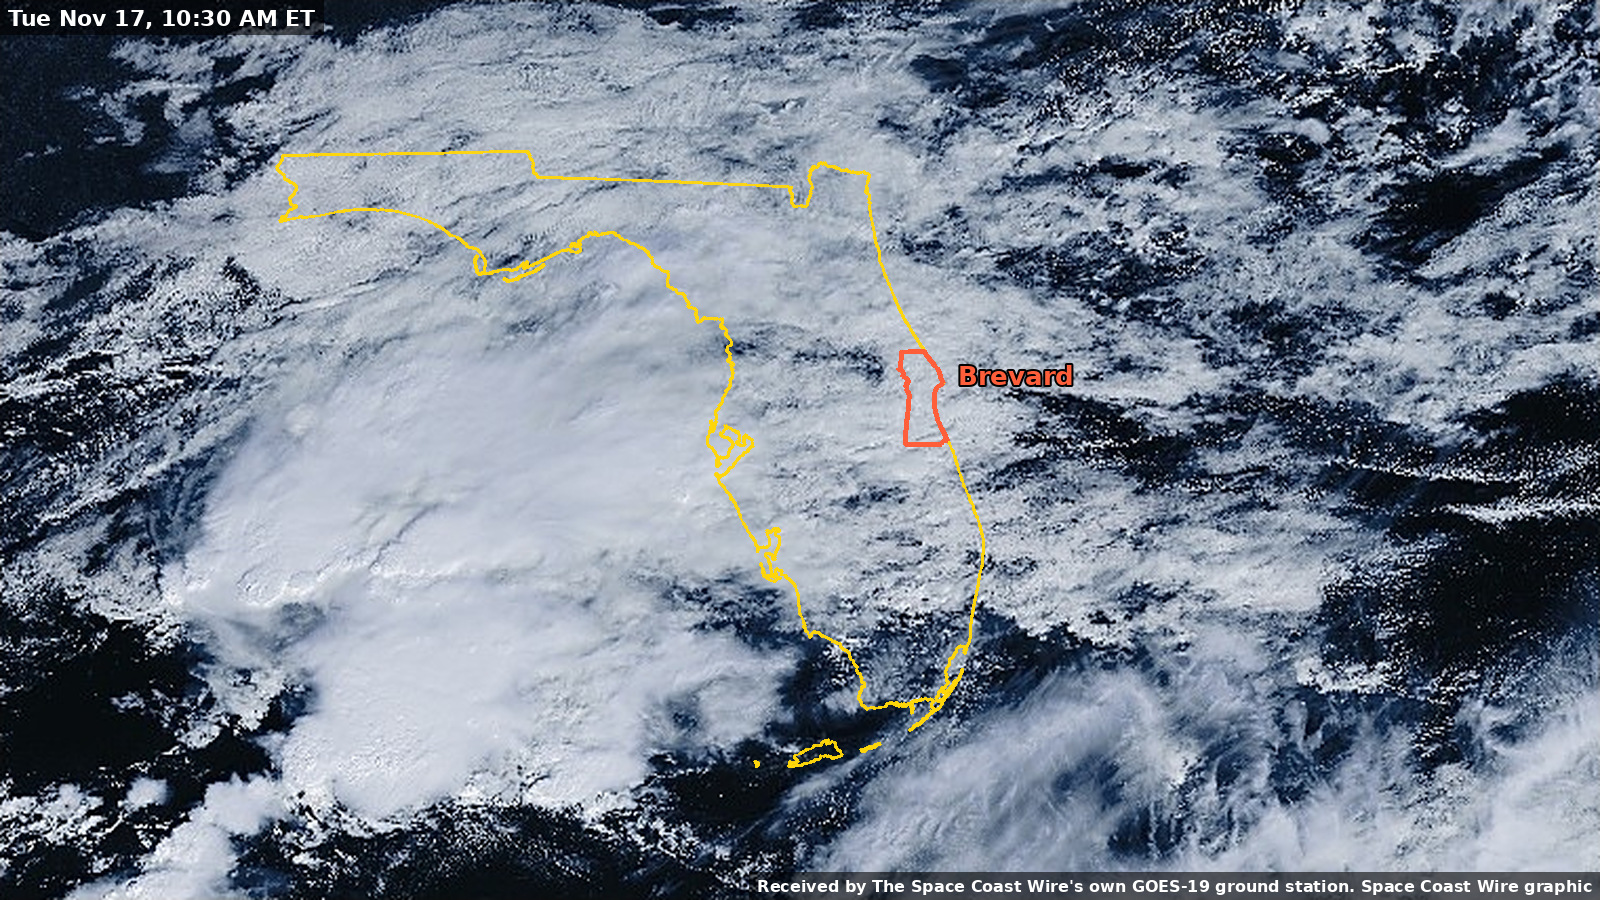
GOES-19 ground station (ours). Our dish pulls images straight from the GOES-19 satellite about every 30 minutes. In daylight, the natural color view shows the cloud shield riding east winds onto the peninsula; at night, color-enhanced infrared picks out the coldest, tallest storm tops over the Gulf and to the south. A 10:30 a.m. Tuesday natural color view is at the top of this story; an 8:30 a.m. Tuesday frame, a Monday midday frame, and a Tuesday afternoon infrared frame are in the photo gallery.
Watch the daytime time lapse, Monday and Tuesday (natural color, daylight frames only; a few midday hours are missing from our reception). Watch the infrared time lapse, Sunday night to Tuesday evening. Both received by The Space Coast Wire's own GOES-19 ground station. Both clips are silent.
NOAA Weather Radio receiver (ours). It decoded 25 alert tones during the last storm, including nine Flash Flood Warnings. Special marine warnings for our coastal waters came first, about a day and again about three hours before the heaviest rain. None have sounded yet this week.
Mesh radio network (ours). Traffic on our off grid mesh dropped by more than 40% on Nov. 2, the wettest day. That is one storm, so we cannot say why.
New instruments. A seismometer, an infrasound sensor and a magnetometer were newly installed and are still being calibrated. We are not using them in this forecast.
The public layers
Moisture is the big difference from Nov. 2. Weather balloons ahead of that storm measured about 1.6 to 2.1 inches of water in the air column. This week it has climbed from about half an inch Saturday to roughly 1.4 inches, our own calculation from NWS balloon data. Offshore, NOAA buoy 41009, about 20 miles east of Cape Canaveral, was reporting seas around 7 to 8 feet Tuesday evening. The east winds, building seas and early showers all match the last storm. The moisture does not, at least not yet.
If the air keeps moistening as forecast, the higher end of these ranges becomes more likely. Never drive through flooded roads, and stay out of the surf: a High Surf Advisory remains in effect along Brevard beaches through 7 a.m. Friday, and a high rip current risk remains in effect through 7 p.m. Thursday.
Data: Space Coast Wire weather station, GOES-19 ground station, weather radio and mesh receivers (ours). NWS Melbourne, NOAA WPC, NOAA NDBC buoys, NWS weather balloon data via Iowa Environmental Mesonet (official/public). Model data via Open-Meteo. Space Coast Wire analysis.
Photos 9
Tap a photo to enlarge it.
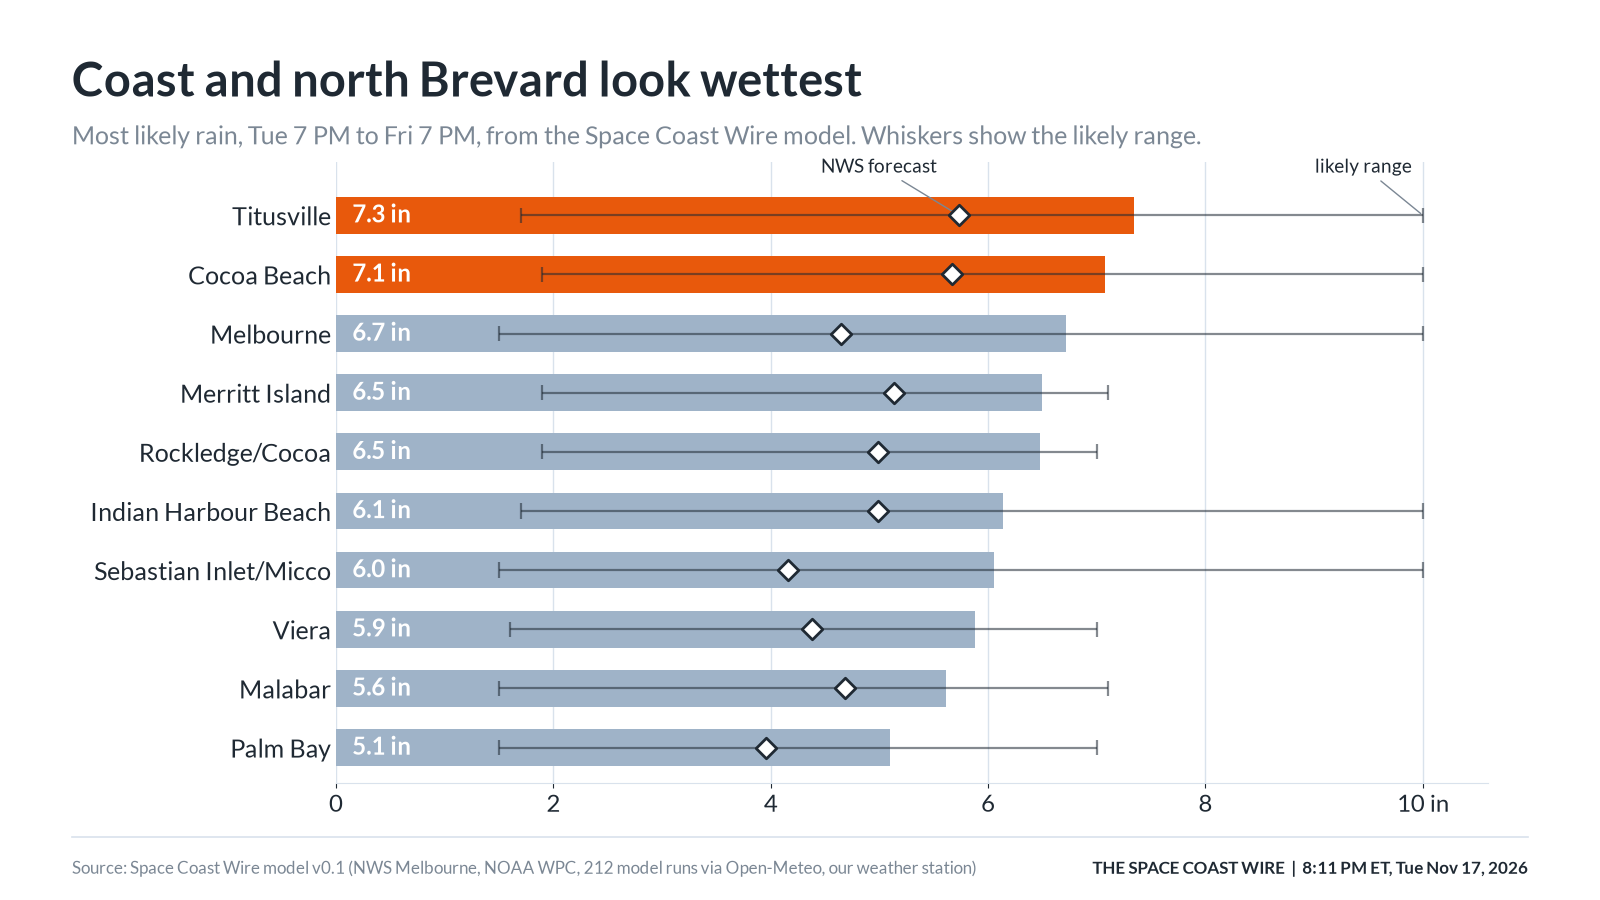
8:11 p.m. ET, Nov. 17, 2026 Most likely rain, Tuesday 7 p.m. to Friday 7 p.m., from the Space Coast Wire model. Whiskers show the likely range. Diamonds mark the NWS forecast. Most likely rain, Tuesday 7 p.m. to Friday 7 p.m., from the Space Coast Wire model. Whiskers show the likely range. Diamonds mark the NWS forecast. Graphic: The Space Coast Wire
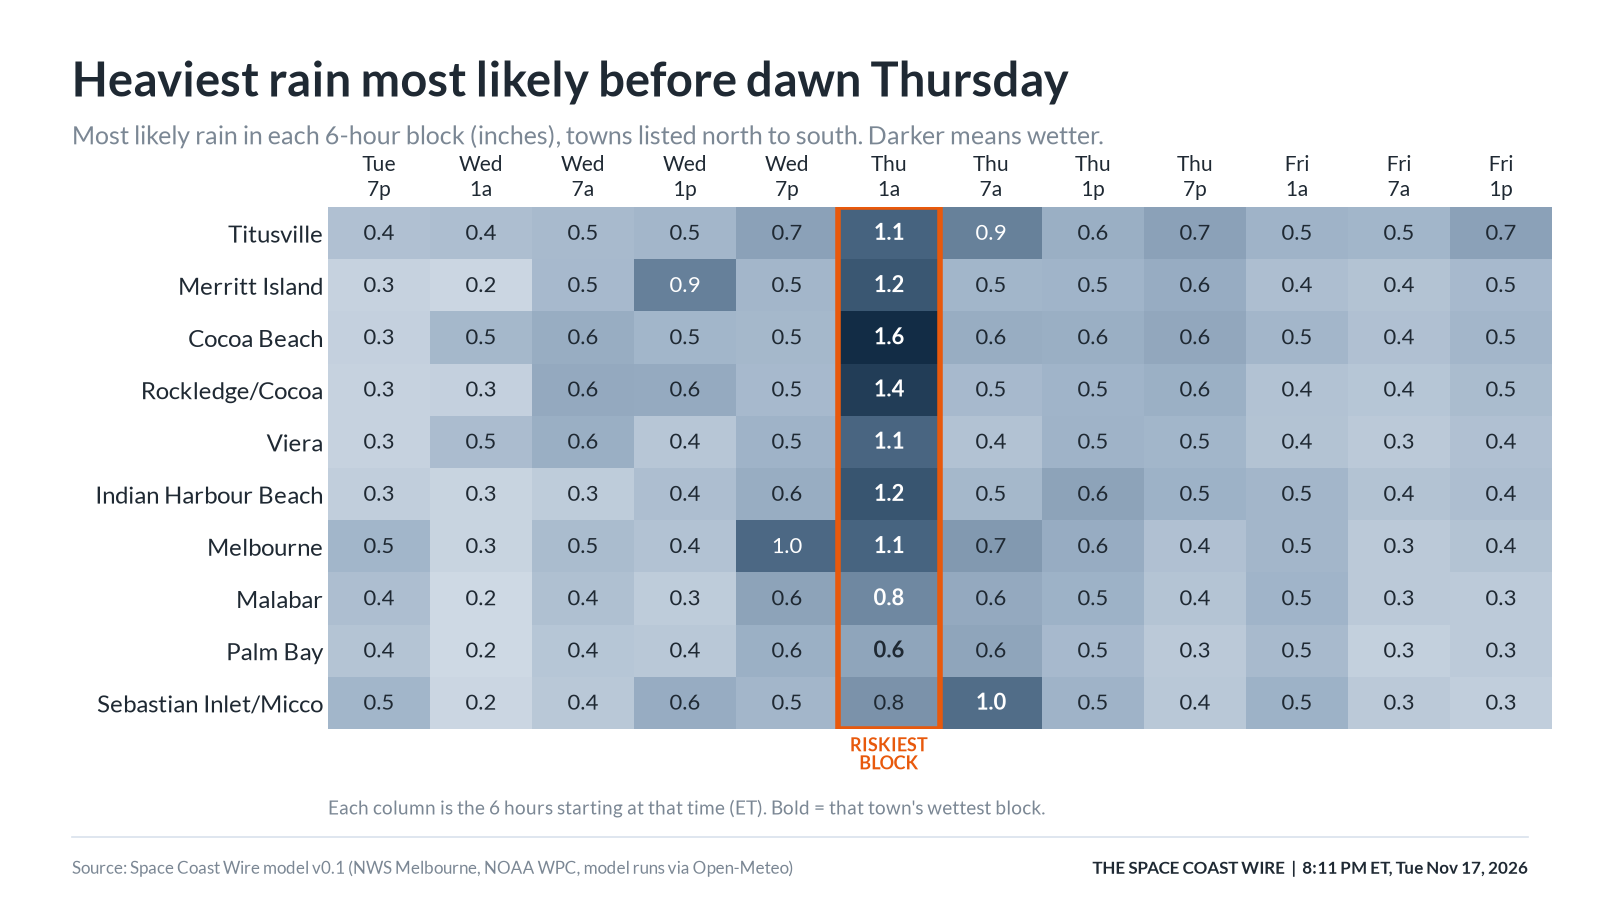
8:11 p.m. ET, Nov. 17, 2026 Most likely rain in each six-hour block (inches). Towns are listed north to south. Darker means wetter. The outlined column is the riskiest block for most of the county. Most likely rain in each six-hour block (inches). Towns are listed north to south. Darker means wetter. The outlined column is the riskiest block for most of the county. Graphic: The Space Coast Wire
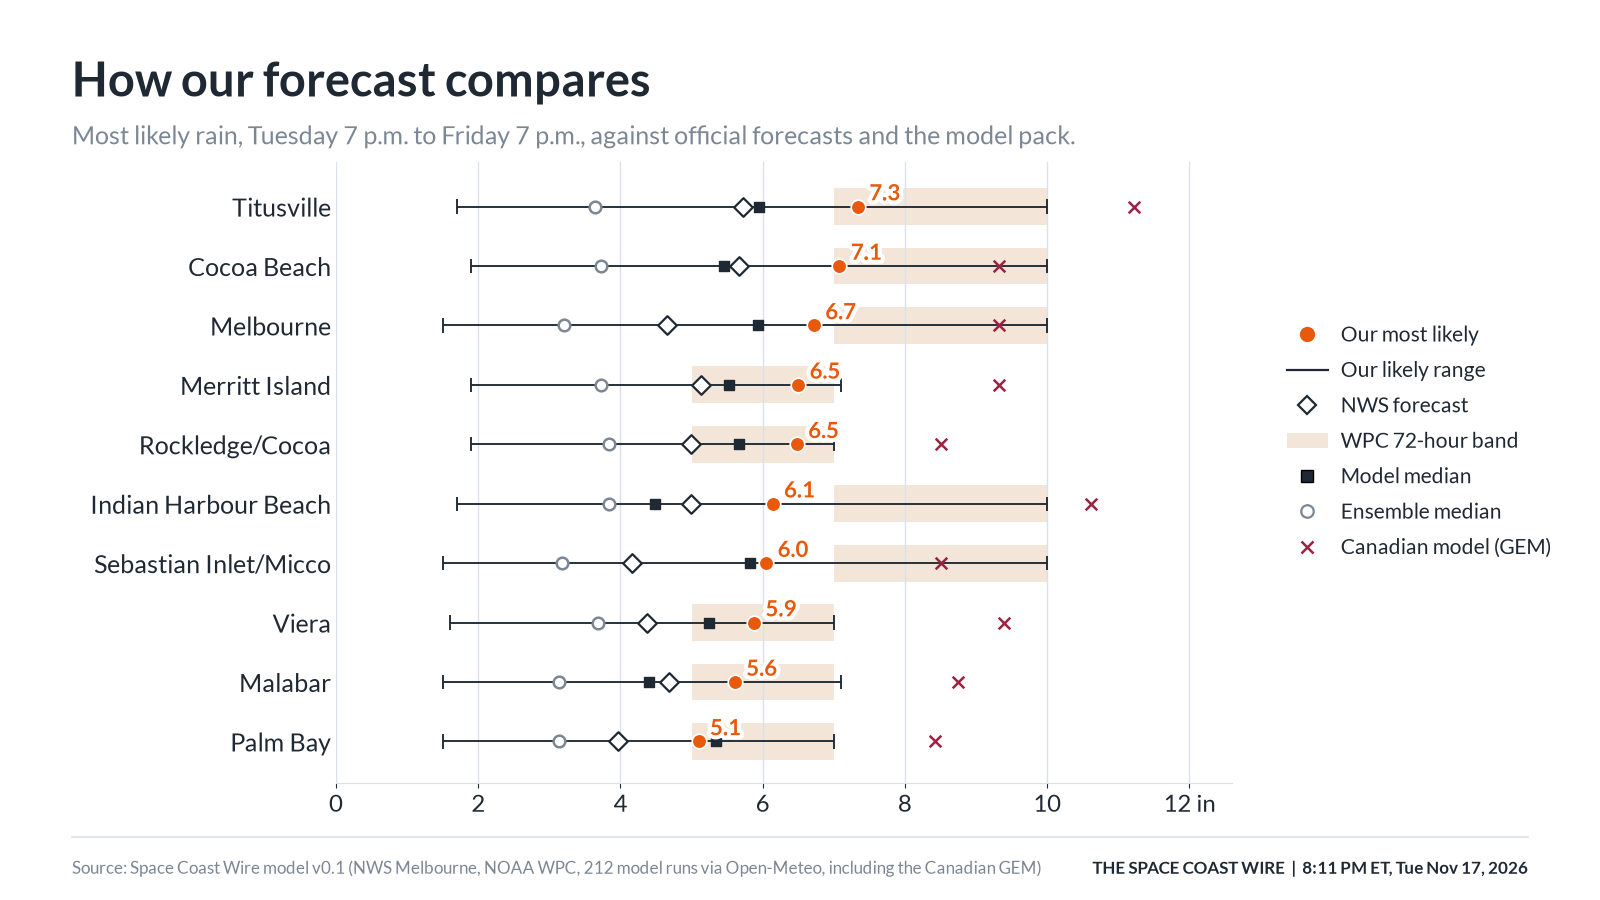
8:11 p.m. ET, Nov. 17, 2026 Our most likely totals are wetter than the NWS forecast and the middle of the computer-model pack, and sit closer to the Weather Prediction Center's three-day range. The Canadian model is wetter still. Our most likely totals are wetter than the NWS forecast and the middle of the computer-model pack, and sit closer to the Weather Prediction Center's three-day range. The Canadian model is wetter still. Graphic: The Space Coast Wire
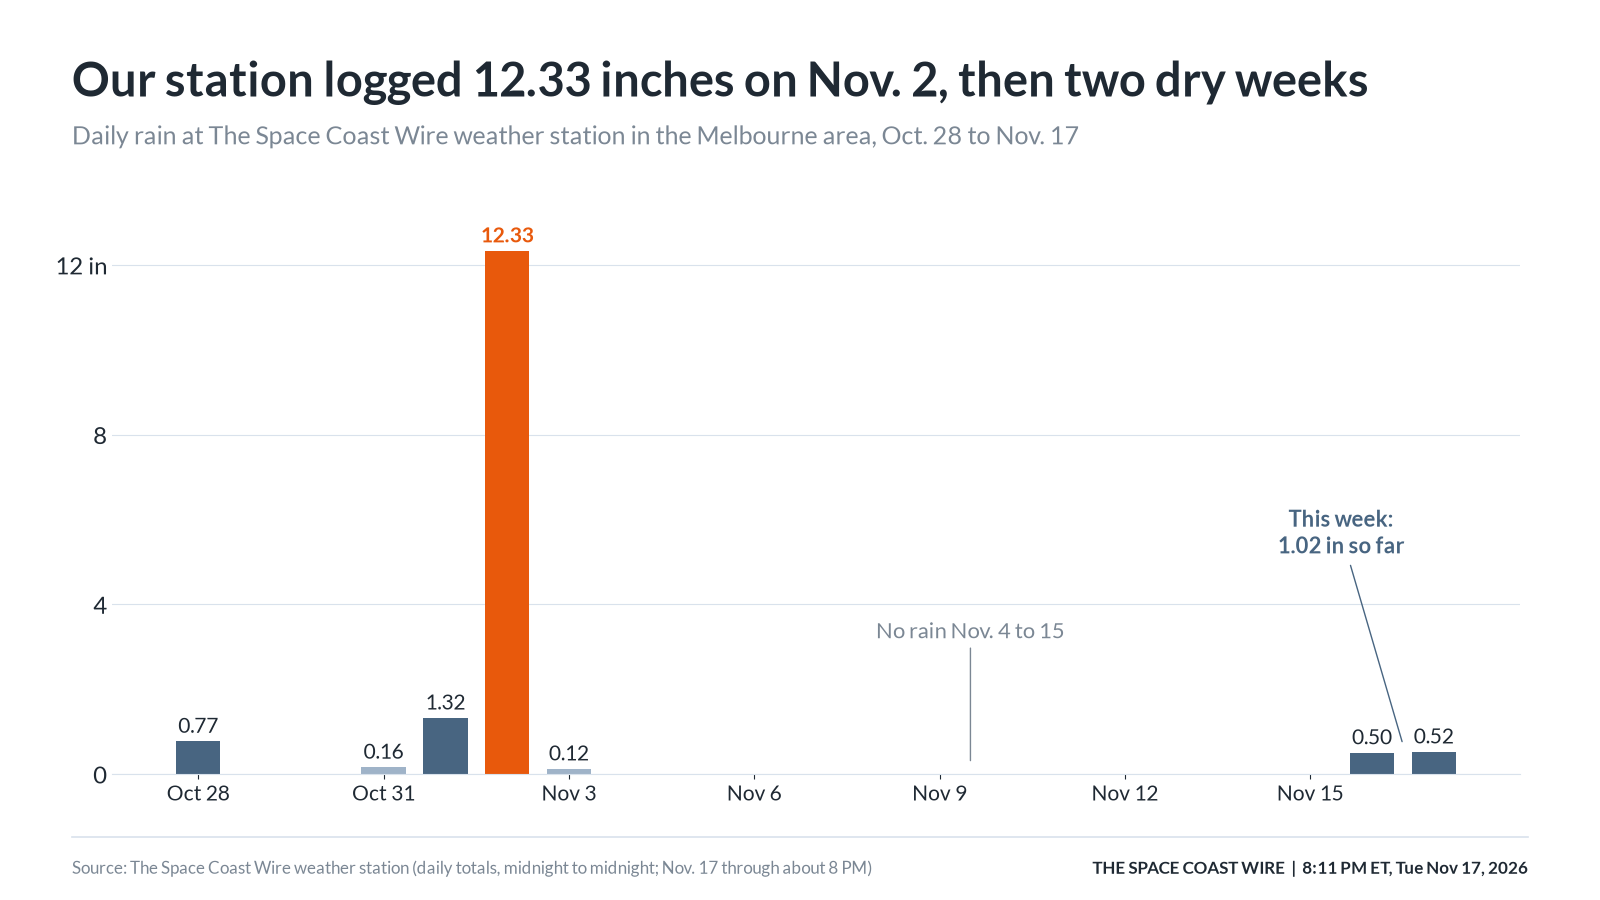
8:11 p.m. ET, Nov. 17, 2026 Daily rain at The Space Coast Wire weather station in the Melbourne area, Oct. 28 to Nov. 17. Nov. 17 is a partial day, through about 8 p.m. Daily rain at The Space Coast Wire weather station in the Melbourne area, Oct. 28 to Nov. 17. Nov. 17 is a partial day, through about 8 p.m. Graphic: The Space Coast Wire
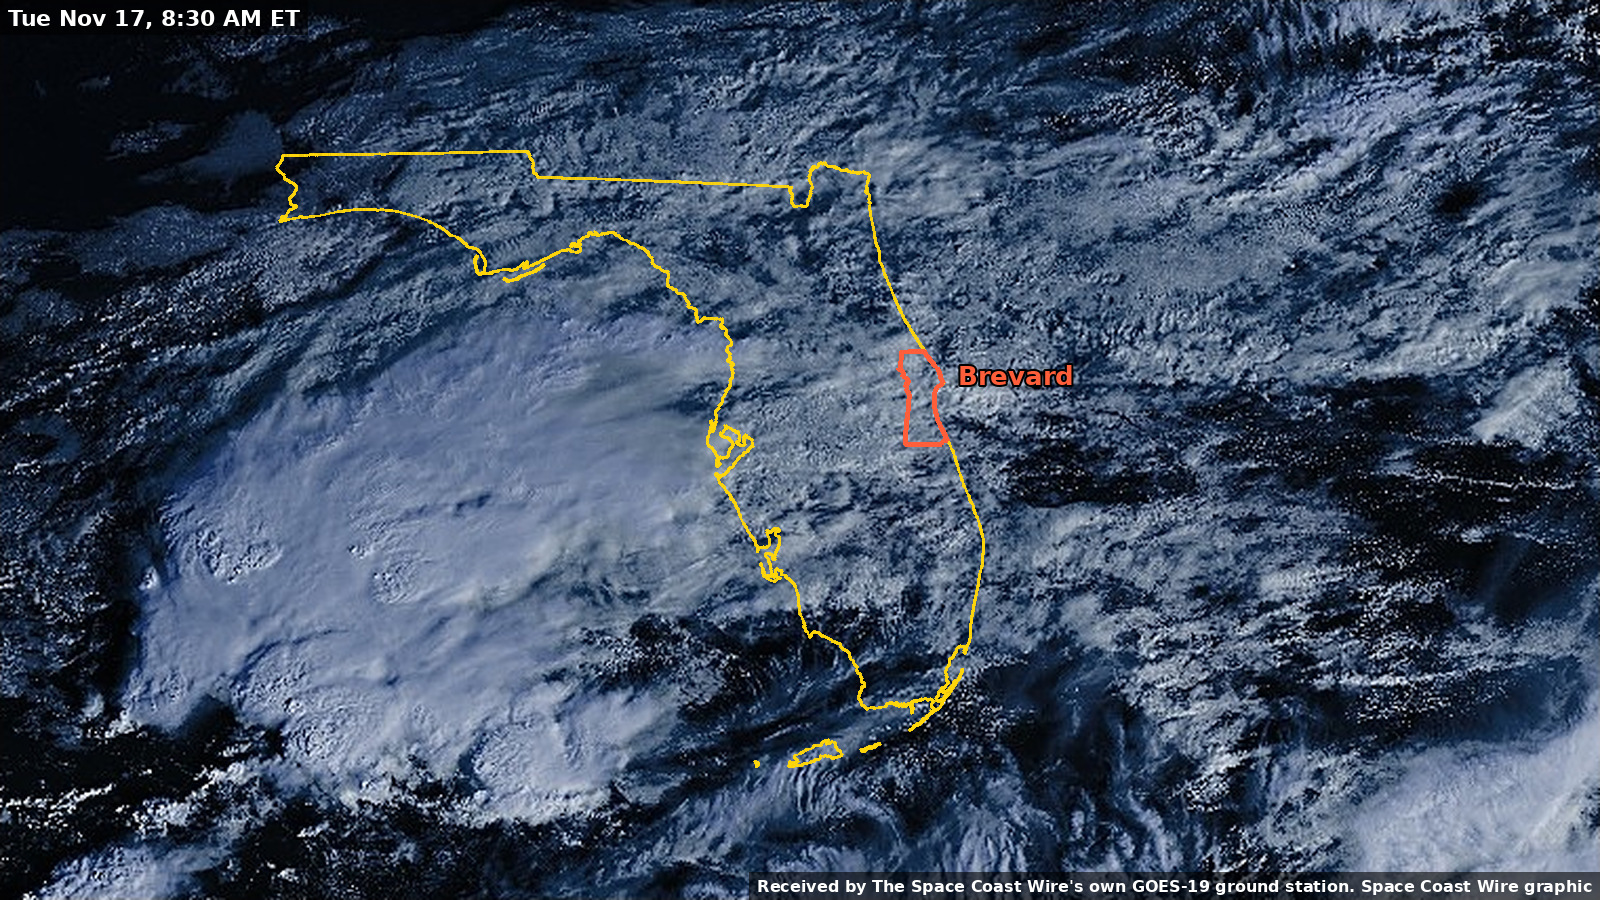
8:30 a.m. ET, Nov. 17, 2026 Tuesday, 8:30 a.m.: clouds blanket the peninsula and the nearby Atlantic in early light. Outlines from U.S. Census boundary files; Space Coast Wire graphic. Tuesday, 8:30 a.m.: clouds blanket the peninsula and the nearby Atlantic in early light. Outlines from U.S. Census boundary files; Space Coast Wire graphic. Received by The Space Coast Wire's own GOES-19 ground station
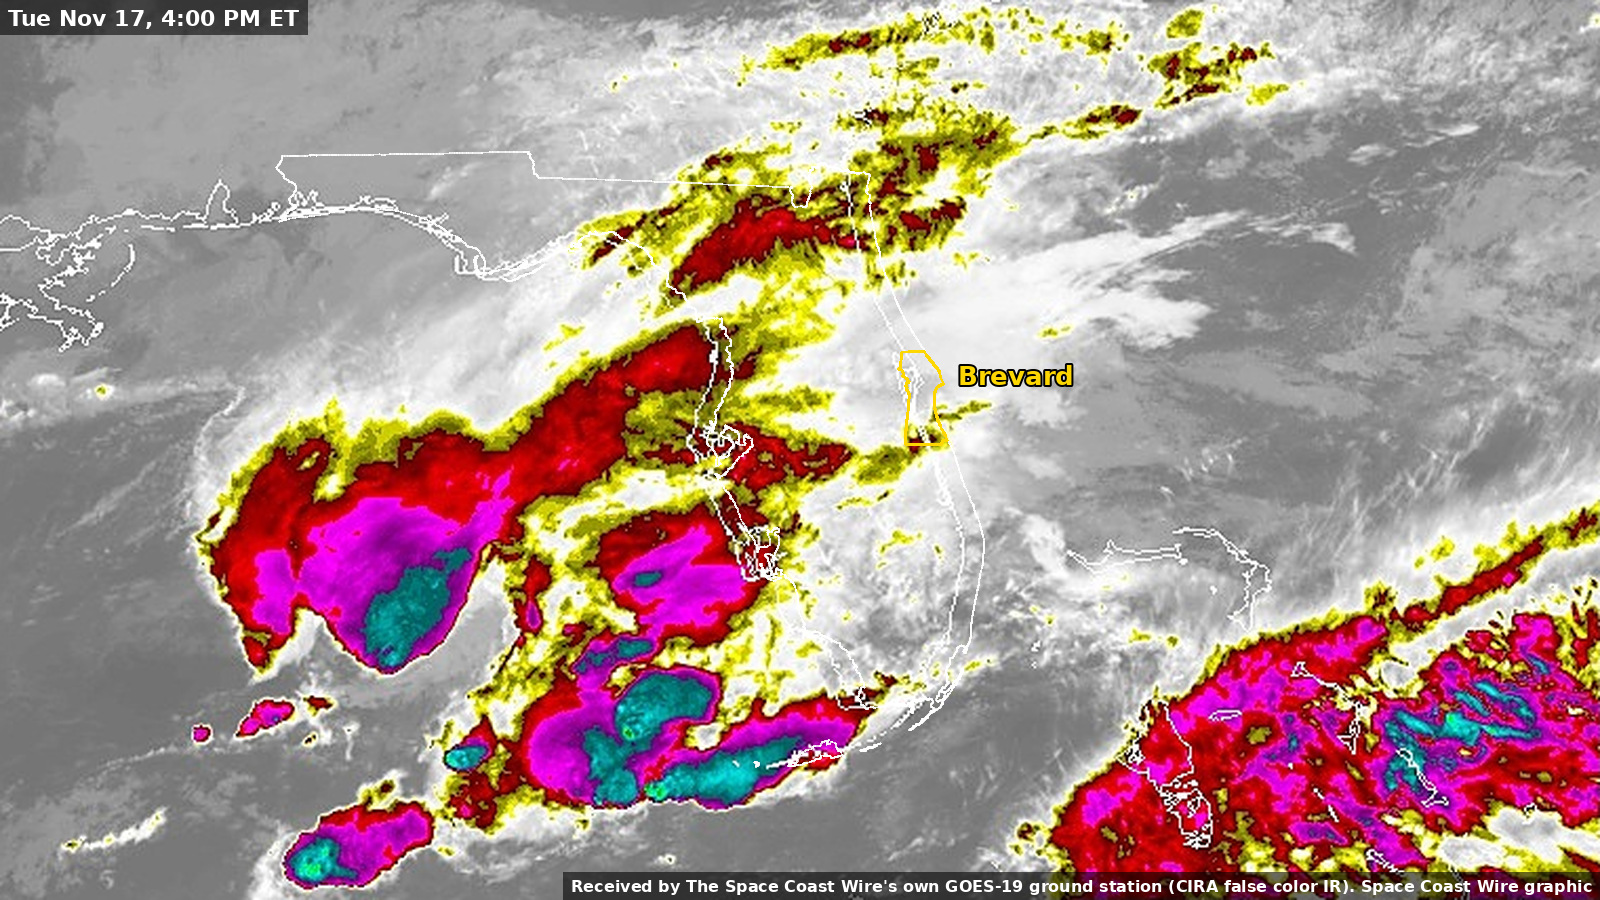
4 p.m. ET, Nov. 17, 2026 Florida at 4 p.m. Tuesday in color-enhanced infrared from NOAA GOES-19. Brightest colors are the coldest, tallest cloud tops. Outlines from U.S. Census boundary files; Space Coast Wire graphic. Florida at 4 p.m. Tuesday in color-enhanced infrared from NOAA GOES-19. Brightest colors are the coldest, tallest cloud tops. Outlines from U.S. Census boundary files; Space Coast Wire graphic. Received by The Space Coast Wire's own GOES-19 ground station
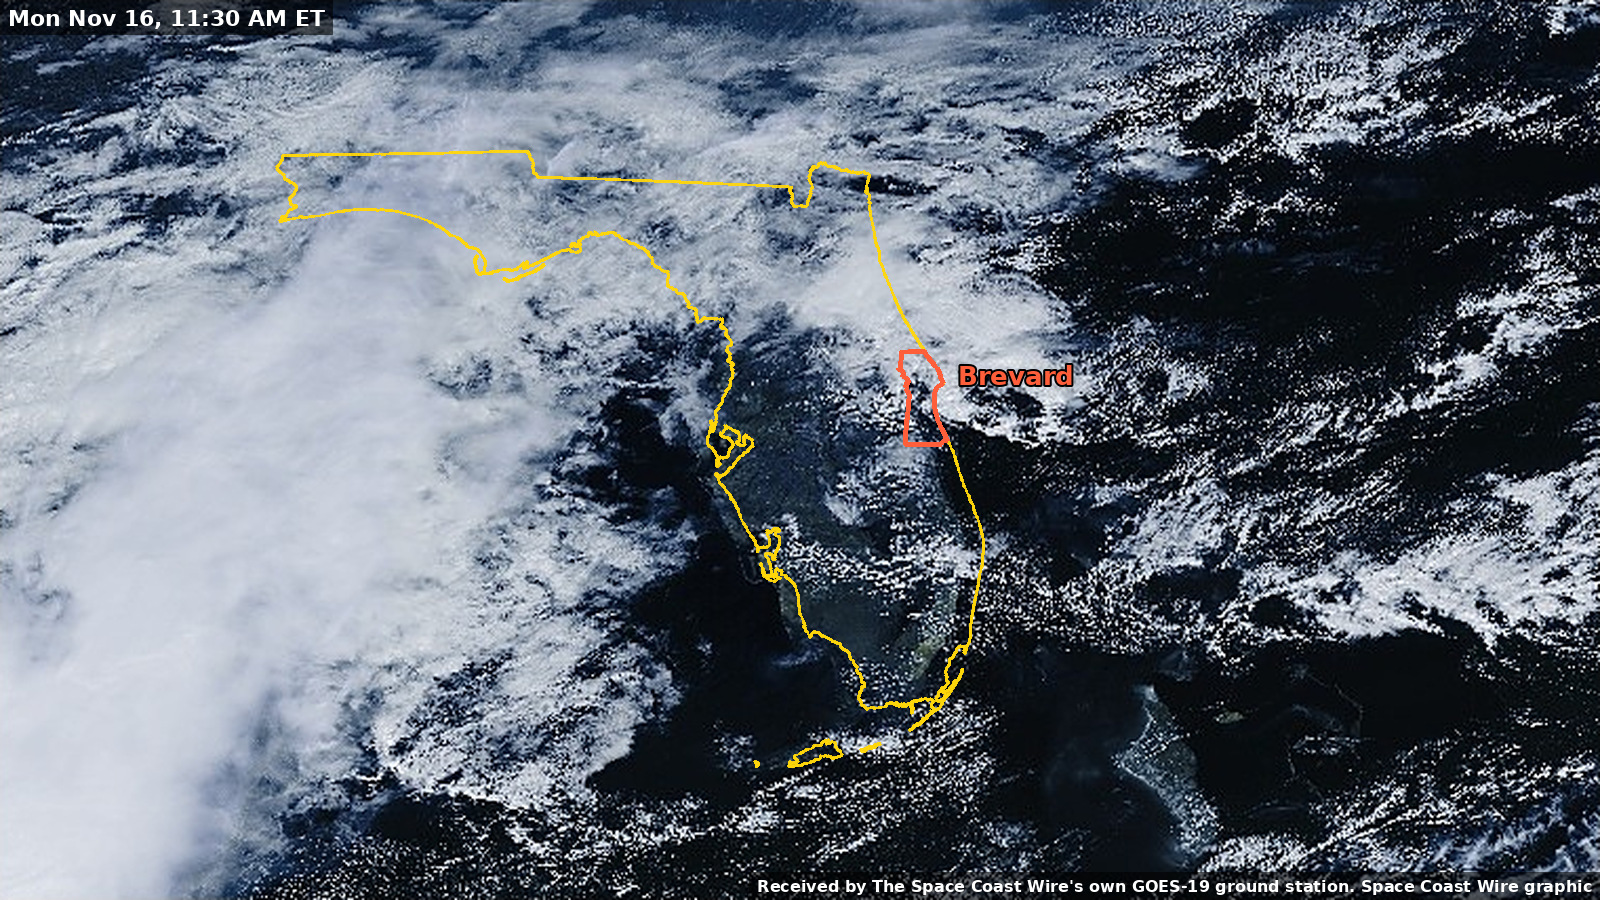
11:30 a.m. ET, Nov. 16, 2026 Monday, 11:30 a.m.: a broad cloud mass over the Gulf and clusters of cloud along the east coast. Outlines from U.S. Census boundary files; Space Coast Wire graphic. Monday, 11:30 a.m.: a broad cloud mass over the Gulf and clusters of cloud along the east coast. Outlines from U.S. Census boundary files; Space Coast Wire graphic. Received by The Space Coast Wire's own GOES-19 ground station
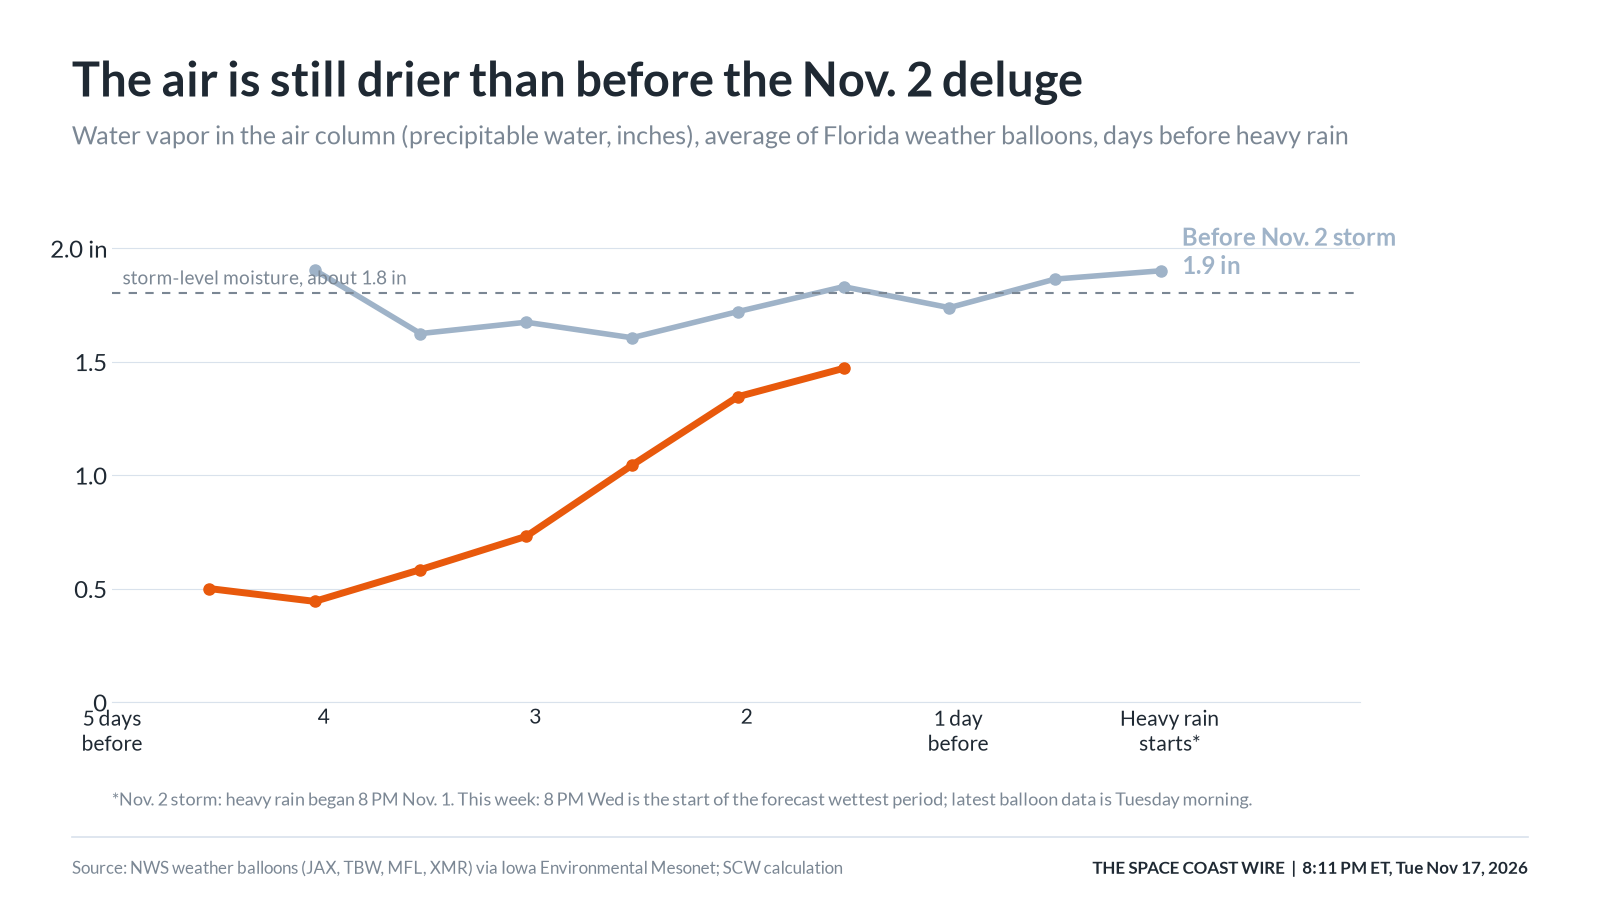
8:11 p.m. ET, Nov. 17, 2026 Precipitable water, in inches, from an average of Florida weather balloons, compared with the days before the Nov. 2 storm. This week's latest balloon data is from Tuesday morning. Precipitable water, in inches, from an average of Florida weather balloons, compared with the days before the Nov. 2 storm. This week's latest balloon data is from Tuesday morning. Graphic: The Space Coast Wire
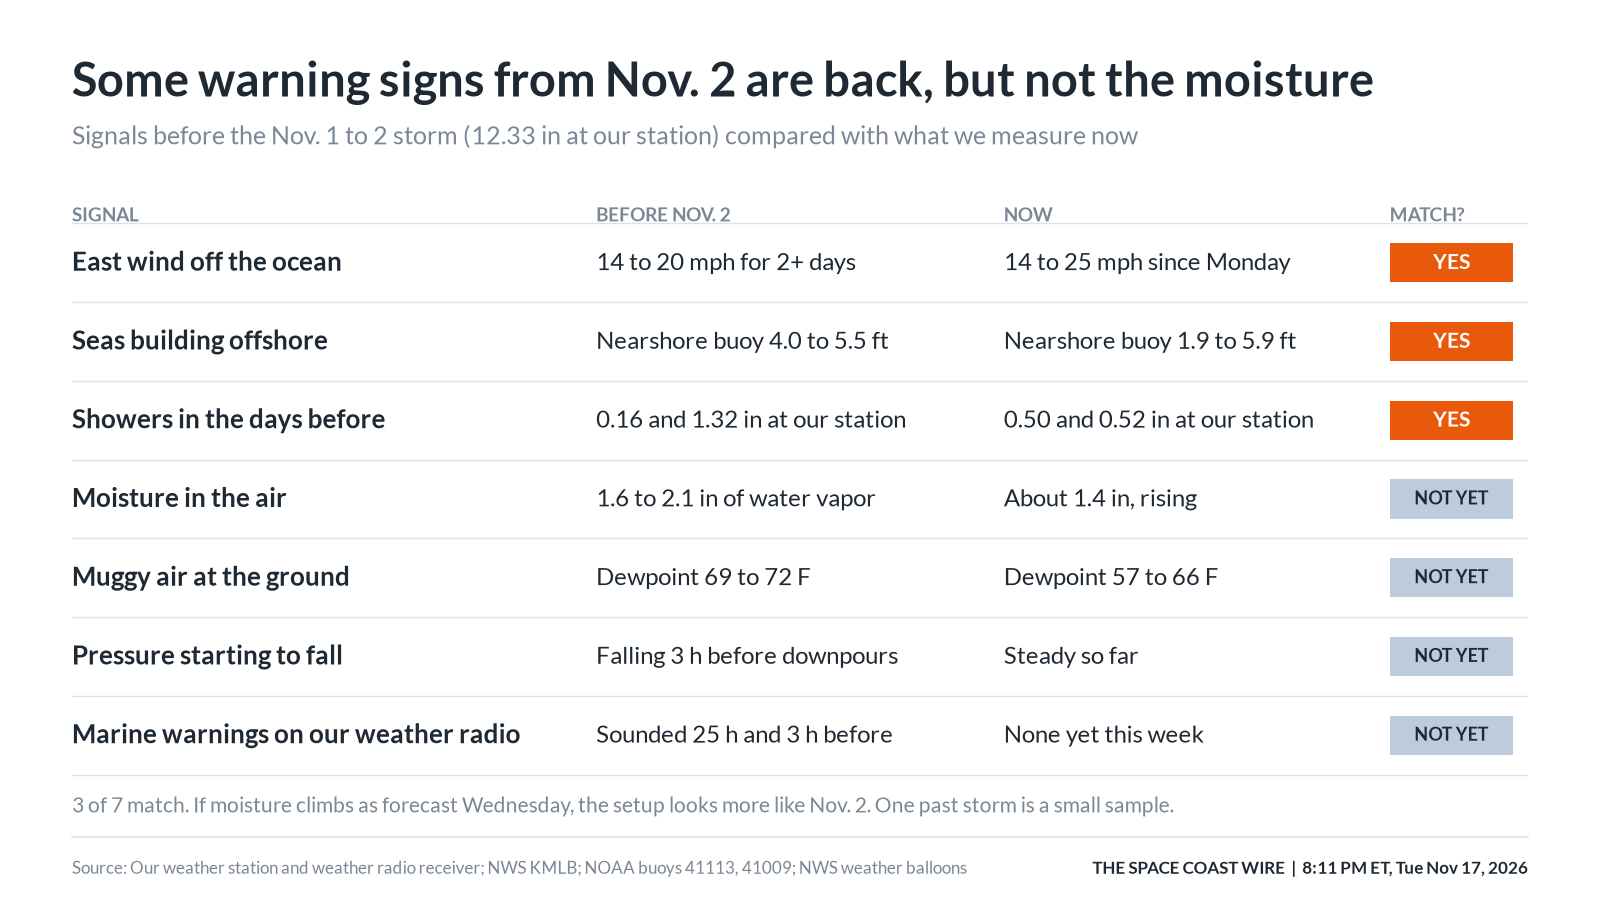
8:11 p.m. ET, Nov. 17, 2026 Signals before the Nov. 1 to 2 storm compared with what we measure now. Three of seven match. One past storm is a small sample. Signals before the Nov. 1 to 2 storm compared with what we measure now. Three of seven match. One past storm is a small sample. Graphic: The Space Coast Wire
‹ Previous9 / 9Next ›Full size
Sources
- NWS Melbourne Area Forecast Discussion, issued 6:48 p.m. EST Tuesday, Nov. 17, 2026 (discussion issued 3:00 p.m. EST) forecast.weather.gov/product.php?issuedby=MLB&product=AFD&site=NWS
- NWS Melbourne Area Forecast Discussion, 6:48 p.m. EST Tuesday, Nov. 17, 2026 (API product 56b93b05-b4d0-49f2-a63f-780d735cc792) api.weather.gov/products/56b93b05-b4d0-49f2-a63f-780d735cc792
- NWS Melbourne Flood Watch (showsigwx for FLZ747 / Brevard County FLC009) forecast.weather.gov/showsigwx.php?warnzone=FLZ747&warncounty=FLC009
Show all 11 sourcesShow fewer
- Active NWS alerts for Southern Brevard Barrier Islands (FLZ747), including the Flood Watch, High Surf Advisory and Rip Current Statement api.weather.gov/alerts/active?zone=FLZ747
- Weather Prediction Center 72-hour QPF, issued about 5:18 p.m. EST Tuesday, Nov. 17, 2026, valid 7 p.m. Tuesday to 7 p.m. Friday www.wpc.ncep.noaa.gov/qpf/qpferd.shtml
- Weather Prediction Center Excessive Rainfall Outlook www.wpc.ncep.noaa.gov/qpf/excessive_rainfall_outlook_ero.html
- NWS Melbourne Coastal Hazard Message (High Surf Advisory and High Rip Current Risk) forecast.weather.gov/product.php?issuedby=MLB&product=CFW&site=NWS
- NOAA National Data Buoy Center, station 41009 (20 nautical miles east of Cape Canaveral) www.ndbc.noaa.gov/station_page.php?station=41009
- Iowa Environmental Mesonet, NWS weather balloon / sounding archive mesonet.agron.iastate.edu/archive/
- Open-Meteo forecast API (model and ensemble runs used in the Space Coast Wire model) open-meteo.com/
- The Space Coast Wire, Tuesday evening rain forecast follow-up, Nov. 17, 2026 spacecoastwire.com/story/brevard-rain-forecast-4-to-6-inches-nov-17
Spot something wrong? Request a correction · Our standards
Comments
Keep it friendly. Rude, hostile or personal-attack comments will be removed.